

Master Grafana Open Source for Superior Data Insights
In today’s data-driven world, the ability to visualize and analyze data effectively is crucial for making informed decisions. Grafana Open Source stands out as one of the leading tools for transforming complex data into insightful, interactive dashboards. This article will explore how to master Grafana, its key features, and how it can empower organizations to harness data for superior insights.
What is Grafana Open Source?
Grafana Open Source is a powerful analytics and monitoring platform designed for visualizing data from various sources. It enables users to create dynamic dashboards that can track performance metrics, identify trends, and detect anomalies in real-time. With its flexibility and robust features, Grafana has become a go-to solution for data analysts, developers, and IT professionals seeking to derive actionable insights from their data.
Key Features of Grafana Open Source
1. Data Source Integration: Grafana supports a wide array of data sources, including relational databases (like MySQL and PostgreSQL), time-series databases (such as InfluxDB and Prometheus), and cloud services (like AWS CloudWatch). This versatility allows users to pull in data from various platforms, creating a holistic view of their metrics.
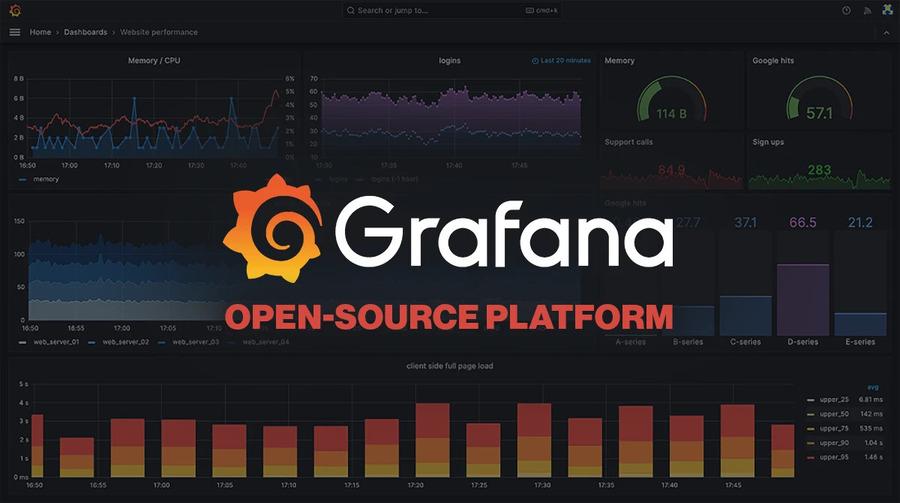
2. Customizable Dashboards: One of Grafana's standout features is its highly customizable dashboards. Users can choose from multiple visualization types, such as graphs, heatmaps, and tables, and tailor them to fit their specific needs. This customization not only enhances data presentation but also improves user engagement and understanding.
3. Alerting and Notifications: Grafana allows users to set up alerts based on predefined conditions, ensuring that they are notified when metrics exceed thresholds or show unusual patterns. This proactive approach helps organizations respond swiftly to potential issues, enhancing operational efficiency.
4. User Management and Permissions: Grafana offers robust user management capabilities, enabling administrators to control access to dashboards and data sources. This feature is essential for maintaining security and ensuring that sensitive information is only available to authorized users.
5. Community and Plugins: Being an open source platform, Grafana boasts a vibrant community that contributes to its growth. Users can leverage a wide range of plugins and extensions to enhance functionality, such as new visualization types, data source integrations, and authentication methods.
Steps to Master Grafana Open Source
1. Installation and Setup: Begin by installing Grafana on your preferred platform (Windows, Linux, or Docker). Follow the official installation guide to get started. Once installed, familiarize yourself with the user interface, exploring its various sections like the dashboard, data sources, and settings.
2. Connect Data Sources: After installation, the next step is to connect your data sources. Navigate to the “Data Sources” section in Grafana and select the appropriate data source type. Input the necessary connection details and test the connection to ensure it's working correctly.
3. Create Your First Dashboard: Once your data sources are connected, it’s time to create your first dashboard. Click on the “+” icon to add a new dashboard, and choose the visualization type you want to use. Drag and drop the visual elements and configure them to display the desired metrics.
4. Experiment with Variables: To enhance interactivity, learn how to use variables in Grafana. Variables allow users to create dynamic dashboards that can adjust based on user input, such as time ranges or specific data points. This feature makes your dashboards more user-friendly and customizable.
5. Set Up Alerts: Implement alerting mechanisms by defining conditions for your metrics. Set thresholds that trigger alerts, and choose how you want to be notified (via email, Slack, etc.). This step is crucial for ensuring you stay informed about critical changes in your data.
6. Leverage the Community: Engage with the Grafana community through forums, GitHub, and other platforms. This engagement can provide you with valuable insights, best practices, and solutions to common challenges.
Conclusion
Mastering Grafana Open Source can significantly enhance your organization’s ability to visualize and analyze data, leading to superior insights and informed decision-making. By integrating various data sources, customizing dashboards, setting up alerts, and engaging with the community, users can unlock the full potential of this powerful tool. As data continues to play an increasingly vital role in business strategy, mastering Grafana is a valuable investment for anyone looking to leverage data effectively. Whether you're a novice or an experienced user, Grafana Open Source offers the features and flexibility needed to elevate your data insights to the next level.