


Behavioral Analytics Explained: Turn User Data into Business Growth
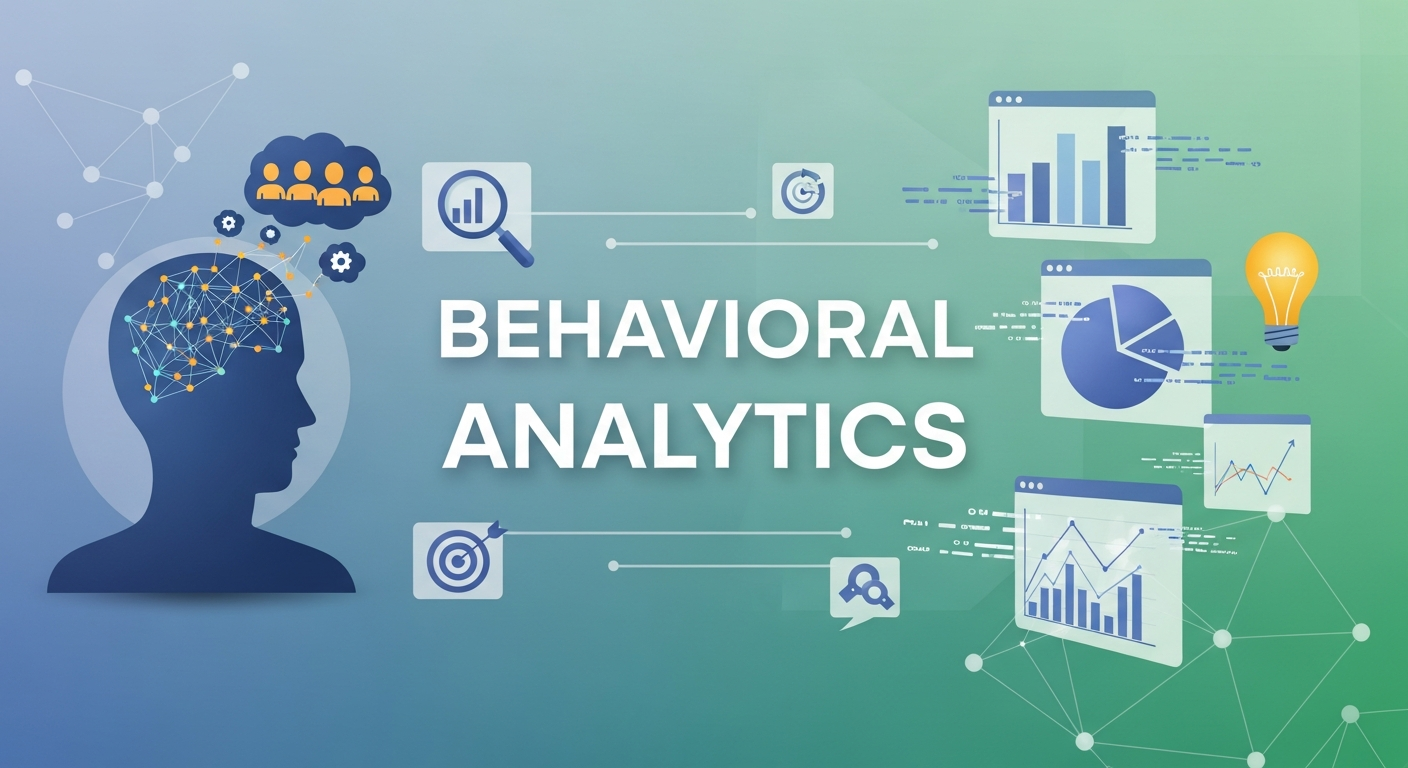
Every click, scroll, and purchase a user makes tells a story. The challenge for most businesses isn't collecting that data—it's knowing what to do with it. That's where behavioral analytics comes in.
Behavioral analytics is the practice of collecting and analyzing data about how users interact with a product, website, or application. Rather than focusing on who your users are (demographics), it focuses on what they actually do—how they navigate your site, where they drop off, which features they use most, and what triggers them to convert or churn. The result? Actionable intelligence that helps businesses make smarter decisions.
This guide breaks down everything you need to know: what behavioral analytics is, how it works, and—most importantly—how to use it to drive meaningful business growth.
What Is Behavioral Analytics?
At its core, behavioral analytics is about understanding human actions through data. It captures granular event data—page views, button clicks, form submissions, session durations—and aggregates it into patterns that reveal how users experience your product.
Traditional analytics tools like Google Analytics can tell you how many people visited a page. Behavioral analytics tells you what those people did once they got there, how long they stayed, where they got stuck, and whether they came back. The difference between the two is the difference between knowing your store had 500 visitors and knowing that 60% of them left without picking up a single product.
Some of the most widely used behavioral analytics platforms include Mixpanel, Amplitude, Heap, and Hotjar. Each offers varying levels of depth, from heatmaps and session recordings to advanced funnel analysis and retention cohorts.
How Does Behavioral Analytics Work?
Behavioral analytics tools typically work by embedding a tracking script into your website or app. This script captures user events in real time—every interaction is logged, timestamped, and tied to a user profile (anonymous or identified).
From there, the data flows into a dashboard where you can:
- Build funnels to see where users drop off in a conversion flow
- Segment users by behavior (e.g., users who clicked a specific CTA vs. those who didn't)
- Analyze retention to understand how often users return after their first visit
- Map user journeys to see the most common paths taken before a conversion
The power of behavioral analytics lies in its specificity. You're not working with broad averages—you're examining real sequences of behavior that lead to real outcomes.
Key Behavioral Analytics Metrics to Track
Not all metrics are created equal. These are the ones that tend to generate the most insight:
Conversion Funnel Drop-Off Rates
A conversion funnel maps the steps a user takes to complete a goal—signing up, purchasing, or upgrading. Drop-off rate measures how many users exit the funnel at each stage. High drop-off at a specific step almost always signals friction: a confusing UI, a slow-loading page, or a form that asks for too much too soon.
Feature Adoption Rate
For SaaS businesses especially, feature adoption rate reveals which parts of your product users actually engage with. Low adoption on a high-priority feature often indicates a discoverability or onboarding problem, not a lack of interest.
Session Depth and Duration
How many pages does a user visit? How long do they stay? These metrics reveal engagement quality. A visitor who reads three articles and spends eight minutes on-site is far more valuable than one who bounces after 10 seconds—and the behavioral data helps you understand what drove that difference.
Retention Cohort Analysis
Cohort analysis groups users by when they first engaged (e.g., users who signed up in January vs. March) and tracks how their behavior evolves over time. This is one of the most powerful tools for identifying what separates users who stick around from those who churn early.
Rage Clicks and Dead Clicks
Popularized by tools like Hotjar and FullStory, rage clicks (where users frantically click an unresponsive element) and dead clicks (where users click on something that isn't interactive) are behavioral signals that something is broken or confusing. Spotting these early can prevent significant drop-off.
How Behavioral Analytics Drives Business Growth
Understanding user behavior isn't just interesting—it's commercially valuable. Here's how businesses are using behavioral analytics to grow.
Optimizing the Customer Journey
The customer journey is rarely as linear as a sales funnel diagram suggests. Behavioral analytics reveals the real paths users take, including the detours, the dead ends, and the surprising shortcuts. With this data, businesses can remove obstacles, streamline navigation, and guide users more effectively toward conversion.
An e-commerce brand, for example, might discover through behavioral data that users who view a product video are 40% more likely to add an item to their cart. That insight directly informs merchandising decisions—surface the video earlier, make it autoplay, A/B test the placement.
Personalizing User Experiences
Personalization has become a baseline expectation for digital products. Behavioral analytics makes it possible to deliver experiences tailored to individual users based on their past actions—recommended content, dynamic pricing, targeted re-engagement emails, and in-app prompts that appear at the exact moment they're most relevant.
Netflix's recommendation engine and Spotify's Discover Weekly are well-known examples of behavioral data at scale. But even smaller businesses can implement behavioral triggers—a SaaS tool might send an automated email when a user hasn't explored a key feature after 7 days of sign-up, nudging them toward activation.
Reducing Churn
Churn is expensive. Acquiring a new customer costs significantly more than retaining an existing one, which makes early churn prediction one of the highest-ROI applications of behavioral analytics.
By analyzing the behavioral patterns of users who churned, businesses can identify leading indicators—a drop in login frequency, failure to complete onboarding, a decrease in feature usage—and act before it's too late. A well-timed in-app message or a targeted email to at-risk users can meaningfully shift retention rates.
Informing Product Development
Product teams often face a tension between intuition and evidence. Behavioral analytics resolves this by grounding product decisions in real usage data. Which features are being ignored? Where are users spending the most time? What paths do power users take that casual users don't?
This data helps product managers prioritize their roadmap around what actually matters to users—rather than what sounds good in a planning meeting.
Improving Marketing ROI
Behavioral data extends beyond the product itself. When integrated with marketing tools, it can tell you which acquisition channels bring in users who actually engage and convert, not just those who sign up and disappear.
A business might discover that users acquired through organic search have twice the 90-day retention rate of those from paid social. That kind of insight fundamentally changes how a marketing budget should be allocated.
Common Challenges in Behavioral Analytics (And How to Overcome Them)
Behavioral analytics is powerful, but it comes with real implementation challenges.
Data overload is a common trap. Tracking every possible event can create noise that obscures signal. Start by defining the three to five user behaviors most closely tied to your core business outcomes, and build your analytics framework around those.
Privacy and compliance requirements—particularly GDPR and CCPA—mean that collecting behavioral data requires clear user consent and transparent data practices. Work closely with your legal team to ensure your tracking setup is compliant, and default to anonymous or pseudonymous data collection wherever possible.
Cross-device tracking is increasingly difficult as users switch between mobile, desktop, and tablet. Many behavioral analytics platforms now offer identity resolution tools to stitch together cross-device sessions, but this remains an imperfect science.
Finally, acting on insights is where many organizations struggle. Data without action is just noise. Build a culture of experimentation by connecting your behavioral analytics platform to an A/B testing tool, and establish a regular cadence for reviewing behavioral insights across product, marketing, and customer success teams.
Getting Started with Behavioral Analytics
You don't need to overhaul your entire tech stack to start. Here's a practical starting point:
- Define your key user events: What actions matter most in your product? Sign-ups, purchases, feature activations, upgrades? Document these first.
- Choose a platform: For early-stage businesses, Hotjar or Microsoft Clarity offer accessible, free entry points. For more advanced funnel and retention analysis, Mixpanel or Amplitude are industry standards.
- Instrument your product: Work with your development team to implement event tracking for your key user actions.
- Set a baseline: Before optimizing, understand your current performance—conversion rates, retention curves, and drop-off points.
- Run experiments: Use the insights from your behavioral data to form hypotheses, test changes, and measure impact.
The Bottom Line on Behavioral Analytics
Data alone doesn't create competitive advantage. The ability to interpret user behavior, extract meaningful patterns, and translate those patterns into product and marketing decisions is what separates high-growth businesses from those that stagnate.
Behavioral analytics provides that capability. Start small, focus on the metrics that tie directly to business outcomes, and build from there. The insights are there—you just need to know where to look.
Frequently Asked Questions
What is behavioral analytics in simple terms?
Behavioral analytics is the process of tracking and analyzing how users interact with a product or website. It captures actions—clicks, scrolls, purchases, sign-ups—and turns them into patterns that help businesses understand user intent and improve the experience.
How is behavioral analytics different from traditional analytics?
Traditional analytics tools measure outcomes—traffic, page views, revenue. Behavioral analytics digs into the actions that led to those outcomes. It explains the "why" behind the numbers, giving businesses a more complete picture of the user experience.
What industries use behavioral analytics?
Behavioral analytics is widely used in e-commerce, SaaS, media, financial services, and healthcare. Any industry with a digital product or website that wants to understand and improve how users engage with it can benefit from behavioral analytics.
What tools are used for behavioral analytics?
Popular behavioral analytics platforms include Mixpanel, Amplitude, Heap, Hotjar, FullStory, and Microsoft Clarity. The best choice depends on the complexity of your product, your team's technical capabilities, and your budget.
Is behavioral analytics the same as user behavior analytics (UBA)?
Not exactly. User behavior analytics (UBA) typically refers to cybersecurity tools that monitor employee and user activity for security threats. Behavioral analytics, in a product and marketing context, focuses on understanding and optimizing the customer experience.
How does behavioral analytics support personalization?
Behavioral analytics identifies patterns in individual user actions, which can be used to trigger personalized experiences—tailored recommendations, in-app messages, or targeted email campaigns—based on what a user has done or is likely to do next.

 Arabic
 Français
 Español
 Português
 Deutsch
 Türkçe
 Dutch
Dutch
 Italiano
 Russian
 Romaian