


Mastering Infographic Design: Best Practices That Convert
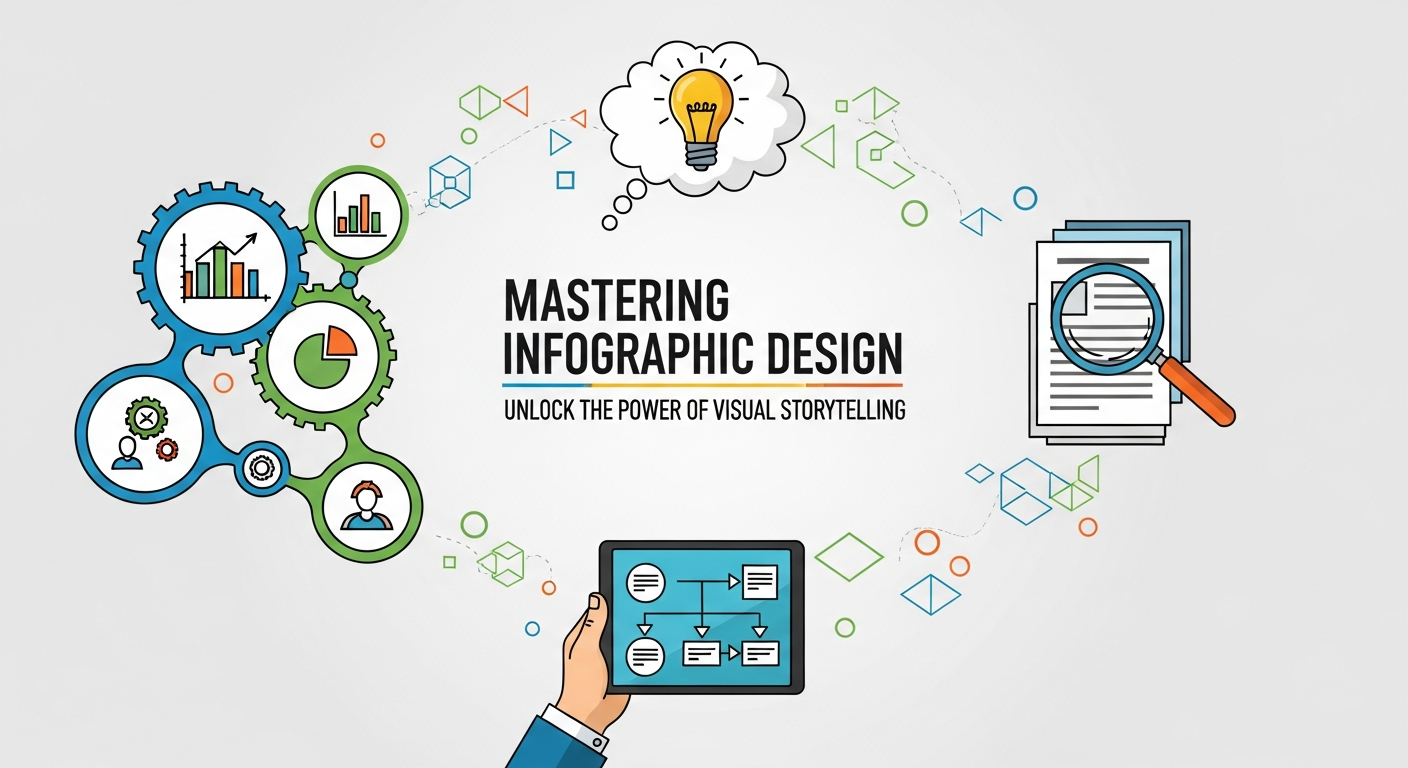
Infographics are some of the most shared content on the internet—but most of them never reach their potential. They're either too cluttered, too vague, or visually forgettable. The good news? Mastering infographic design doesn't require a degree in graphic design. It requires understanding a few core principles that separate a scroll-stopper from a scroll-past.
This guide walks you through everything you need to know about infographic design—from choosing the right type and layout to selecting colors, fonts, and data visualizations. Whether you're creating content for a brand, a blog, or a client, these best practices will help you produce infographics that inform, engage, and convert.
Why Infographic Design Matters More Than You Think
Data is everywhere. The challenge for marketers and content creators isn't finding information—it's communicating it in a way people actually absorb. That's where infographic design earns its keep.
Research consistently shows that people process visual information far faster than text. Infographics combine imagery, data, and narrative into a single cohesive format that's easy to scan and easy to share. For brands, this translates directly into more engagement, more backlinks, and more time spent on page.
But here's the catch: a poorly designed infographic can do more harm than good. Cluttered layouts, conflicting colors, and misleading charts can confuse your audience—or worse, damage your credibility. Mastering infographic design means knowing not just what looks good, but what communicates clearly.
What Type of Infographic Should You Use?
Before opening your design tool, you need to answer one question: what story am I trying to tell? The answer determines which type of infographic will serve you best.
Statistical Infographics
These focus on data—percentages, survey results, comparisons. They work well when the numbers themselves are the story. If you're publishing research findings or industry benchmarks, a statistical infographic gives your data the visual weight it deserves.
Process Infographics
Use these when you need to explain steps in a sequence. How-to guides, workflows, and onboarding flows all translate well into process infographics. The key is clarity—each step should flow naturally into the next without requiring extra explanation.
Timeline Infographics
Timelines are ideal for historical overviews, product roadmaps, or showing how something has evolved over time. The chronological structure does most of the organizational work for you.
Comparison Infographics
These pit two or more options against each other—products, strategies, ideas. Side-by-side layouts make comparisons intuitive and easy to digest.
Informational Infographics
When your goal is to educate rather than persuade, informational infographics break down a complex topic into digestible chunks. Think explainers, glossaries, and "beginner's guide" content.
Choosing the wrong type is one of the most common infographic design mistakes. Match your format to your message, not the other way around.
The Anatomy of a High-Converting Infographic
Start With a Strong Headline
Your headline is the first thing people read. It needs to tell them exactly what they're about to learn—and make them want to keep going. Keep it specific. "5 Reasons Your Email Open Rates Are Dropping" outperforms "Email Marketing Tips" every time.
Strong infographic headlines often include a number, a clear benefit, or a curiosity-triggering question. Avoid vague or generic titles that could apply to any piece of content.
Lead With Your Most Compelling Information
Attention spans are short. Don't save the best for last. Lead with your most interesting stat, your boldest claim, or the clearest summary of what the infographic covers. Give readers a reason to keep scrolling within the first few seconds of viewing.
Use a Clear Visual Hierarchy
Visual hierarchy controls where the eye goes first, second, and third. In infographic design, you establish hierarchy through size, color, contrast, and spacing. Your headline should be the largest element. Subheadings and data points come next. Supporting text sits below that.
Without hierarchy, every element competes for attention—and nothing wins.
Color Theory in Infographic Design
Color is one of the most powerful tools in an infographic designer's kit. Used well, it guides the eye, reinforces your message, and creates emotional resonance. Used poorly, it creates visual chaos.
Stick to a Limited Color Palette
The most effective infographics typically use three to five colors. This creates cohesion and prevents the design from feeling overwhelming. Choose one dominant color, one or two accent colors, and a neutral for backgrounds and text.
Tools like Adobe Color, Coolors, and Canva's color palette generator make this process straightforward, even for non-designers.
Use Color to Signal Meaning
Color can do communicative work beyond aesthetics. In comparison infographics, use contrasting colors for different options. In process infographics, a progression of shades can visually reinforce movement from step to step. In data visualizations, color helps group related data points.
The key principle: be consistent. If red means "negative" in one section of your infographic, it should mean "negative" throughout.
Consider Accessibility
Around 8% of men and 0.5% of women experience some form of color blindness, according to the National Eye Institute. Relying solely on color to convey information risks excluding a portion of your audience. Use labels, patterns, and icons alongside color to ensure your infographic is accessible to everyone.
Typography Rules for Infographic Design
Font choices affect readability far more than most designers realize. A stunning layout falls apart if the text is hard to read.
Use No More Than Two Typefaces
Mixing too many fonts creates visual noise. Stick to one typeface for headings and one for body text. Pair a strong display font with a clean, readable sans-serif for the best results. Classic pairings include Montserrat with Open Sans, or Playfair Display with Lato.
Prioritize Legibility Over Style
Decorative fonts have their place, but not in body copy. If someone has to work to read your text, they won't. Keep body text at a minimum of 10pt (print) or 14px (digital), and ensure sufficient contrast between your text and its background.
Use Text Sparingly
Infographics are visual by nature. If your design is text-heavy, reconsider what can be communicated visually instead. A good rule of thumb: if a section has more than 40 words, look for opportunities to replace some of that text with an icon, chart, or illustration.
How to Visualize Data Effectively
Data visualization is at the heart of most infographic design. Choosing the right chart or graph is just as important as choosing the right colors or fonts.
Match Your Chart to Your Data Type
- Bar charts work best for comparing quantities across categories.
- Line charts show trends over time.
- Pie charts illustrate part-to-whole relationships—but only use them when you have five or fewer segments.
- Scatter plots reveal correlations between two variables.
Using the wrong chart type is a surprisingly common error. A pie chart with 12 segments, for example, is nearly impossible to interpret at a glance.
Don't Distort Your Data
Visual distortions—like bar charts that don't start at zero, or 3D effects that skew proportions—mislead your audience, even unintentionally. Always double-check that your visuals accurately represent the underlying data.
Annotate Key Data Points
Don't leave your audience to draw their own conclusions from a chart. Highlight the most important data point with a callout or annotation. Tell readers what they should take away from each visualization.
Layout and Composition Best Practices
Design for Vertical Scrolling
Most infographics live online, which means vertical layouts work best. Design for a width of around 800px and let the height extend as needed. Horizontal infographics can work for print or presentations, but they're harder to consume on a screen.
Use White Space Generously
White space—the empty areas of a design—is not wasted space. It gives visual elements room to breathe, guides the eye, and prevents the design from feeling crowded. Resist the urge to fill every inch of your canvas.
Create a Logical Flow
Your reader should be able to move through your infographic naturally, from top to bottom, without confusion. Use arrows, numbered steps, or clear visual transitions to guide them through the content. If a reader has to stop and figure out where to look next, the layout has failed.
Optimizing Infographics for Sharing and SEO
A beautifully designed infographic that nobody sees is a missed opportunity. Distribution and optimization matter just as much as design quality.
Add an Embed Code
Make it easy for other websites to share your infographic by providing an embed code. Every embed earns you a backlink, which strengthens your site's SEO authority.
Optimize the Image File
Save infographics as PNG files for crisp quality without excessive file size. Compress images using tools like TinyPNG before uploading. Slower load times hurt both user experience and search rankings.
Write a Keyword-Rich Alt Text
Search engines can't read images. Alt text tells them what your infographic contains. Include your focus keyword naturally—for example, "Infographic showing mastering infographic design best practices for marketers."
Pair Your Infographic With a Written Summary
Publishing your infographic alongside a written breakdown serves two purposes. It makes your content accessible to readers who prefer text, and it gives search engines something substantive to index. This combination tends to perform significantly better in search results than the image alone.
Common Infographic Design Mistakes to Avoid
Even experienced designers fall into these traps:
- Overloading with information: An infographic that tries to say everything ends up saying nothing. Focus on one clear takeaway.
- Inconsistent styling: Mismatched fonts, colors, or icon styles make a design look unprofessional. Use a design system or template to maintain consistency.
- Ignoring mobile viewers: Over 60% of web traffic comes from mobile devices. Preview your infographic on a small screen before publishing.
- Skipping the proofreading step: A typo or data error in a widely shared infographic is difficult to recover from. Always have a second set of eyes review your work.
Turn Your Next Infographic Into a Conversion Machine
Mastering infographic design is a process of iteration. Each infographic you create teaches you something new about what resonates with your audience—what layout draws attention, which color combinations feel right, what level of data complexity keeps readers engaged without overwhelming them.
Start by picking one type of infographic that matches your next content goal. Apply the layout, color, and typography principles covered here. Distribute it strategically, optimize it for search, and measure the results.
The designers who produce consistently great infographics aren't necessarily more talented—they're more deliberate. They know the rules, and they apply them with intention. Now you do too.

 English
 Arabic
 Français
 Español
 Português
 Deutsch
 Türkçe
 Dutch
Dutch
 Italiano
 Russian